
 Are you thinking about selling your home on your own, but need help to determine how much money you can get for your home? You have no idea at what price to list your home? You are not alone. This is the second most common struggle with homeowners selling their home their own according to the 2013 annual Realtor survey.
Big Problem, Big Solution – Home Value Estimator System
We are going to give you a step by step guide on how to use Zillow to determine what homes have sold for around you and at what price homes currently are listed for sale . You will be creating your own Home Value Estimator System. Once you are finished reading this article, you will be able to spend an hour or two researching your local market and know exactly how much to ask for your home. I used this exact Home Value Estimator System to sell my last home and received 95% of my asking price which was $1,000 over my target price.
This Home Value Estimator System will also give you a very good understanding of the real estate market in your local area. In fact, you will know more than most real estate agents in your town. In this tutorial, I am going to assume you have some basic spreadsheet experience.
Let’s get started!
Home Value Estimator System Step # 1 – Get Organized
We are going to start by creating a spreadsheet for your Home Value Estimator System. I’m going to use Microsoft Excel, but you can also use Google Docs or Numbers for Mac. If you don’t have any of these, you can download a trial version of Microsoft Excel by clicking here.
Open up Excel and create a new spreadsheet. Save the spreadsheet on your computer with a name that you will remember like HomeValueEstimator.xlsx.
You are going to create the following columns:
- Neighborhood – This is the address for where the home is located. We are going to be looking at homes both inside and outside of your neighborhood. It could be a subdivision, a condo complex name, a zip code, or even a town name.
- Address – This is going to be the street address where the home is located.
- Link – This will be a link to this home in Zillow. You can make a hyperlink out of the address field if you like or just put this in its own column.
- Price – This is the list price of the home for sale or the price at which it was sold.
- Date Sold – This is the date that the home was sold. If the home is still for sale, this cell will be blank.
- Date Listed – This is the date that the home was listed for sale.
- Square Feet – The total number of square feet listed for the home.
- Rooms – The number of bedrooms in the home.
- Bathrooms – The number of bathrooms in the home.
- Special – Note anything special about the home. Is it on the water or does it have a pool? Does it have a parking space? Was it sold as a foreclosure? Anything that you feel will drive the price up or down significantly should be noted.
- Price Per Square Foot – This field will be a calculated field and I’ll show you that calculation fields later.
- Average Price Per Square Foot – This is another calculation field.
- Days on Market – This is the last calculation field.
Click the image to make it larger
If you don’t want to create this spreadsheet yourself, you can get access to my template by clicking here.
Home Value Estimator System Step #2 – Let's Get Some Data
Now this is the fun part. We are going to Zillow.com to search for your home address. (I recommend setting up an account if you do not already have one.) For this training, I am going to use a house for sale in my neighborhood as an example – 8585 Walden Glen Dr, Jacksonville, FL 32256.
Open up Zillow.com and type in your home address, city, state and zip code. Hit enter or click the green search magnifying glass.
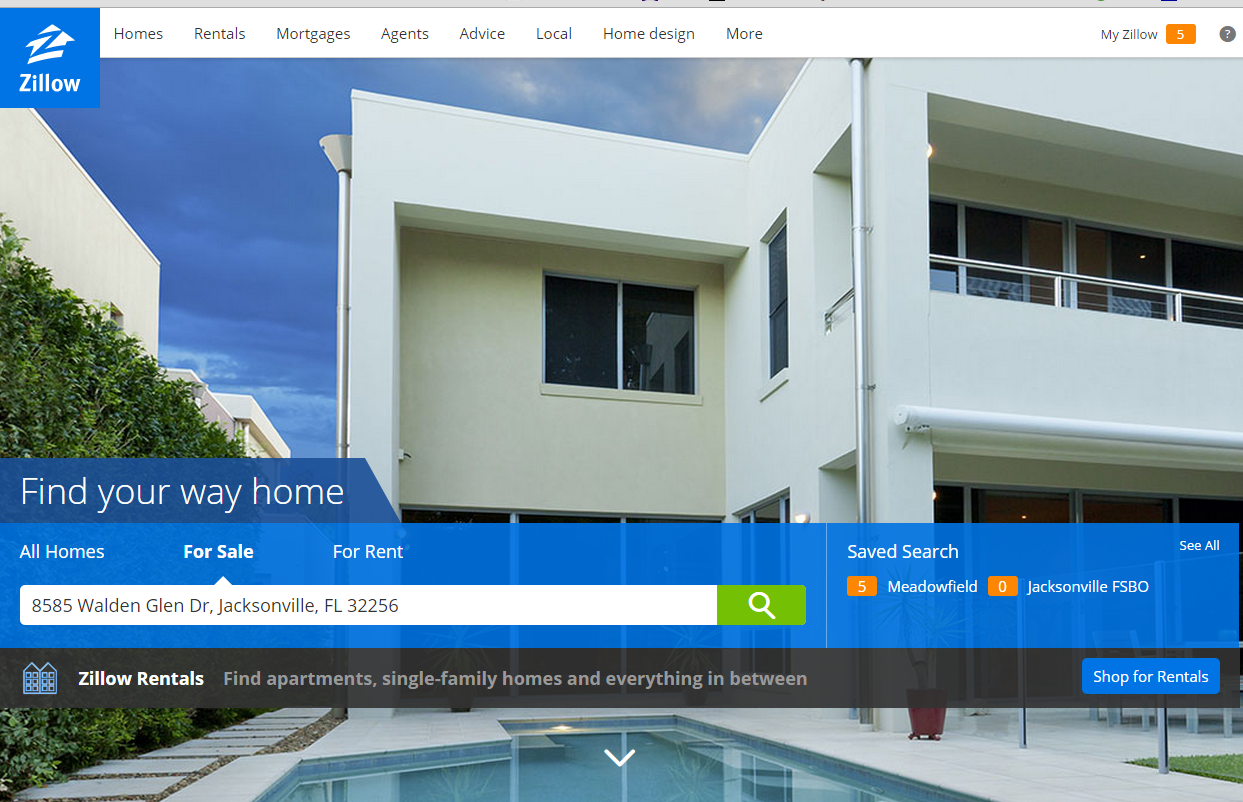
Click the image to make it larger
Next, you are going adjust your filter to show you all homes for sale and recently sold. Click on the listing type, select the For Sale and Recently Sold categories. Make sure that after you click the check box For Sale, that all the subcategories (By Agent, By Owner, etc) are selected. Once you make your selections, click anywhere on the map to get out of the menu. The selections will update the map as you check them and uncheck them.

Click the image to make it larger
Once you have your listings up, we will start adding home value data to the spreadsheet. Click on one of the listings and you will notice that the home value listing details will appear at the right hand side of your screen.
From here, we have everything we need to fill in our spreadsheet with home values.
Now let’s fill in the Home Value Estimator System spreadsheet.
- Neighborhood – Type in the name of the neighborhood. In this case, I will type in Hampton Glen.
- 1 – Address – copy and paste the address. Copy it from Zillow and then double click in your address field in Excel and then paste it.
- 2 – Price – Record the sale price (home value) if the property has already sold. If the home has not yet been sold, enter the current for sale/listing price.
- 3 – Link – Copy and paste the link from the address bar.
- 4 – Date Sold – If the home has already sold, you may need to scroll down to the Price section to find the date sold. If the home has not yet sold, leave this blank.
- 5 – Date listed – While you are down in the price section, copy and paste the date listed.
- 6 – Square feet – Scroll back up and copy and paste the square feet.
- 7 – Rooms – Type the number of bedrooms in the home.
- 8 – Bathrooms – Type the number of bathrooms in the home.
- 9 – Special – Read the description and note anything special about the home that could make the value go up or down. Remember this could be a pool, a guest house, a parking spot, or even a foreclosure.
- If you come across a home that is very similar to your home, it is worth putting an asterisk (*) in front of the address. This will often be the case when you are in a condo or the same builder built many similar style of homes around you.
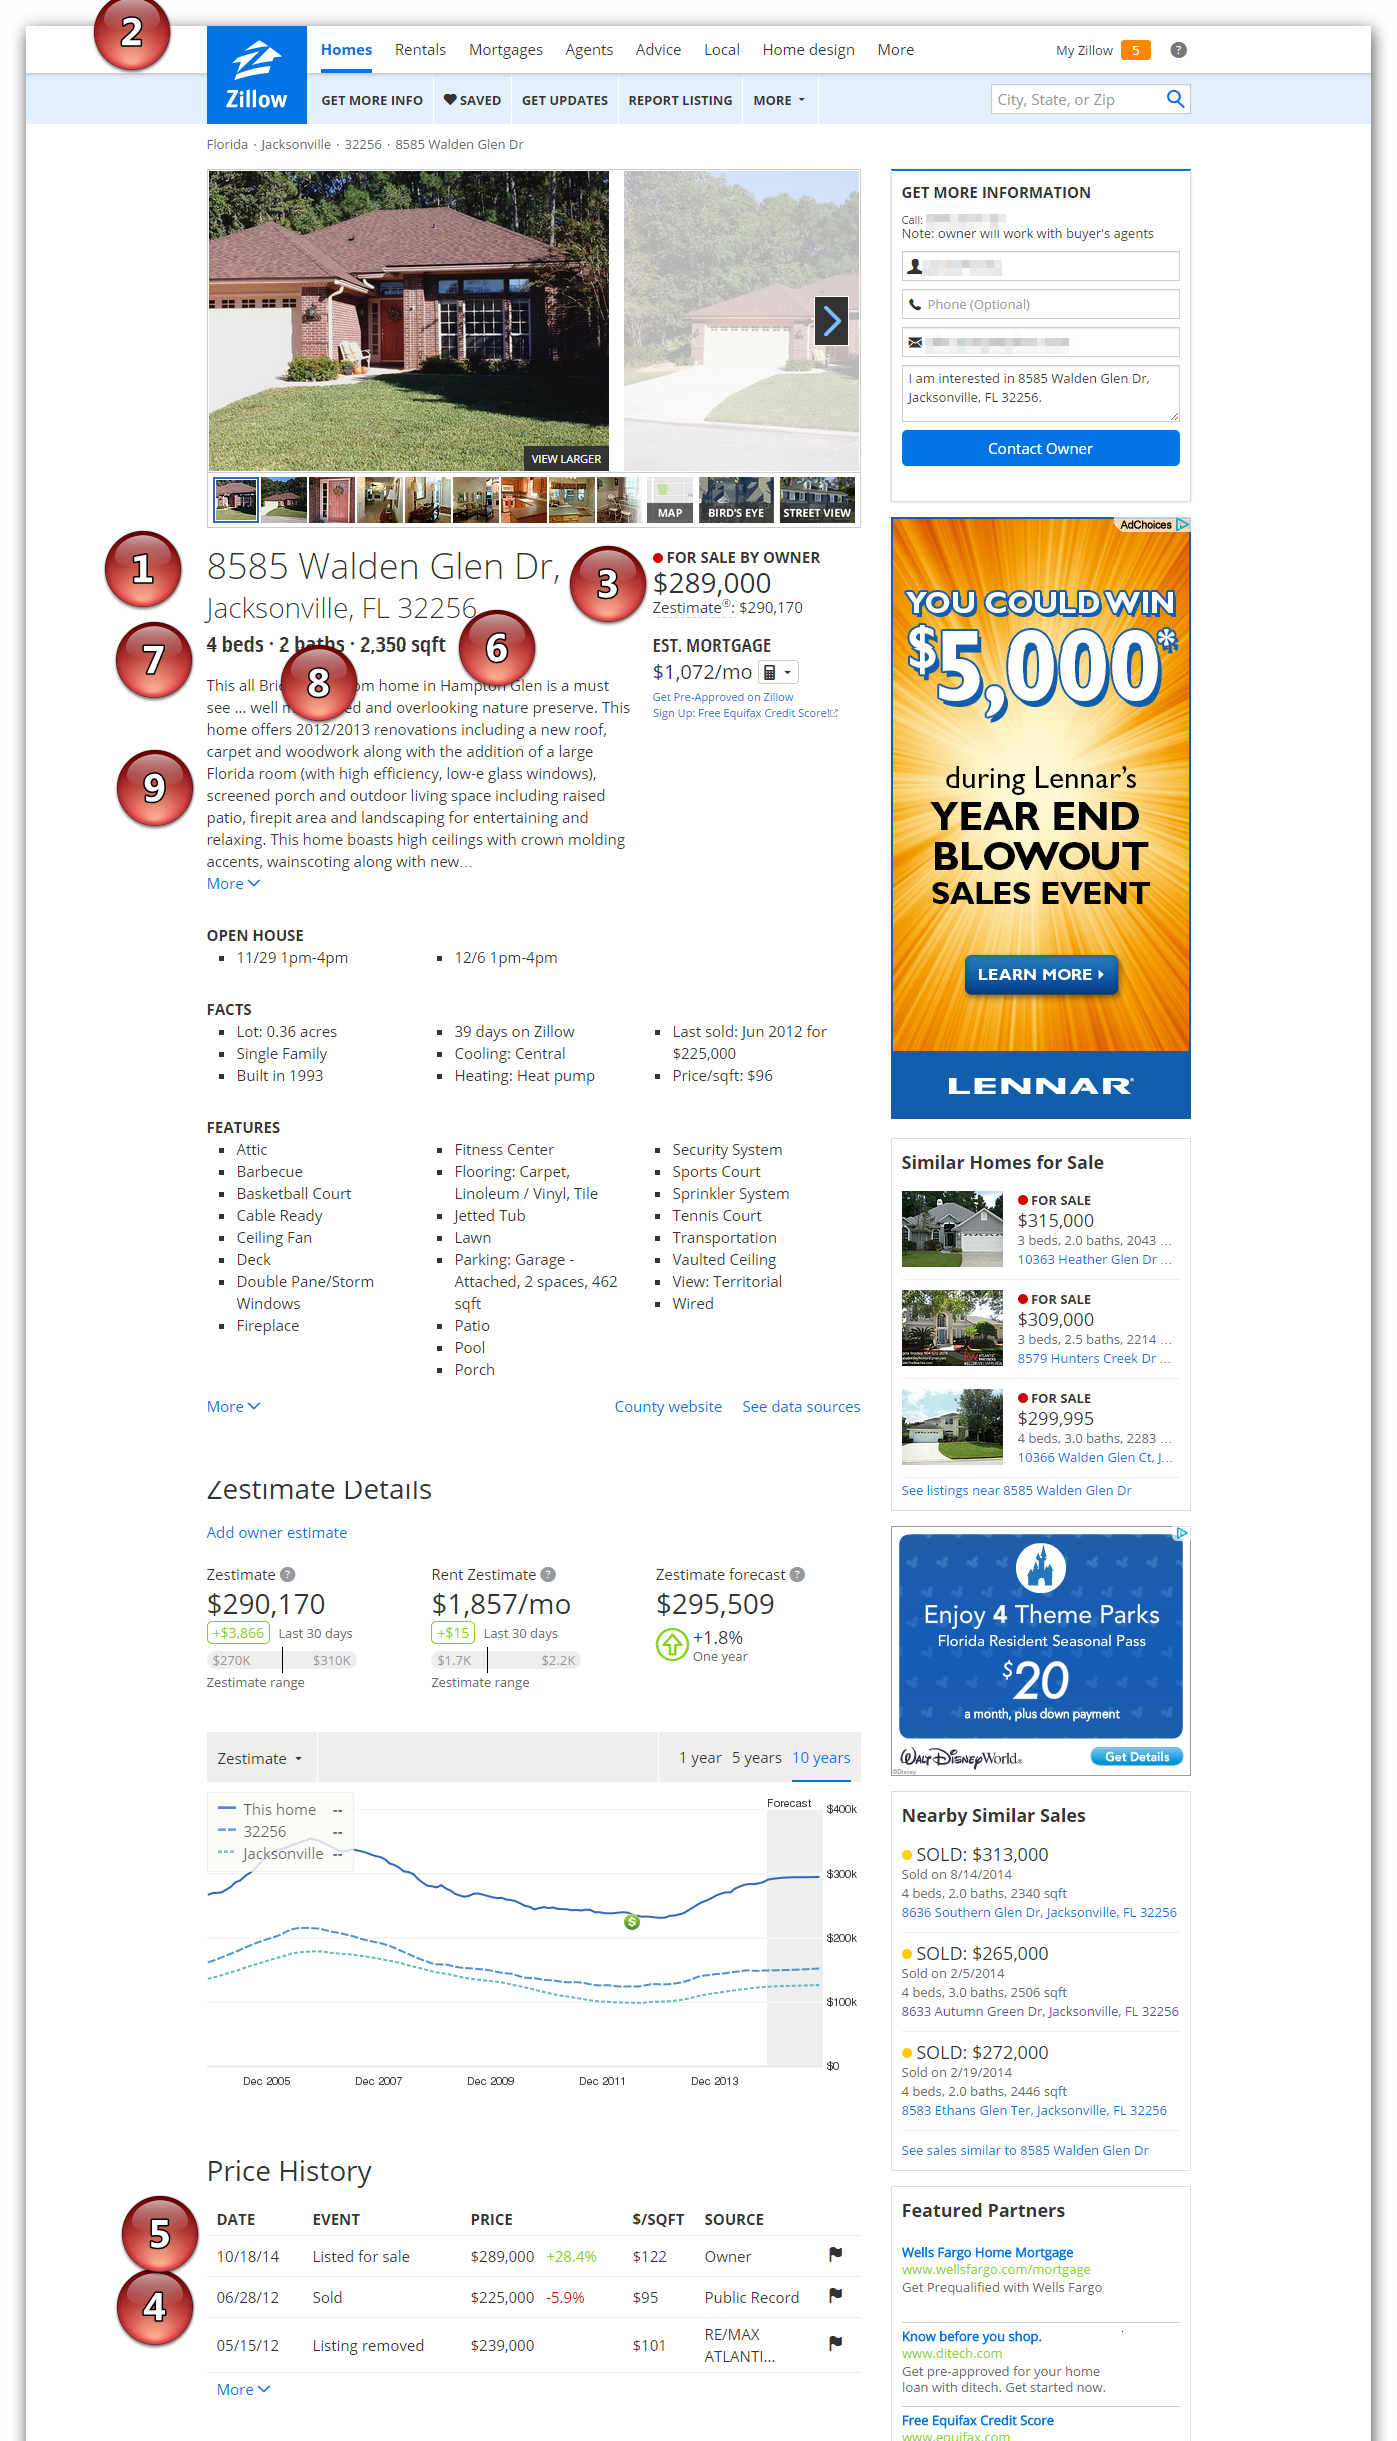
Click on this image to make it larger
Now, let’s move onto the next listing.
- 1 – Save your listing – Don’t forget to click the little save heart so you can see that you have already entered this into your spreadsheet.
- 2 – Go to the next listing by clicking on the next home to get another home value.
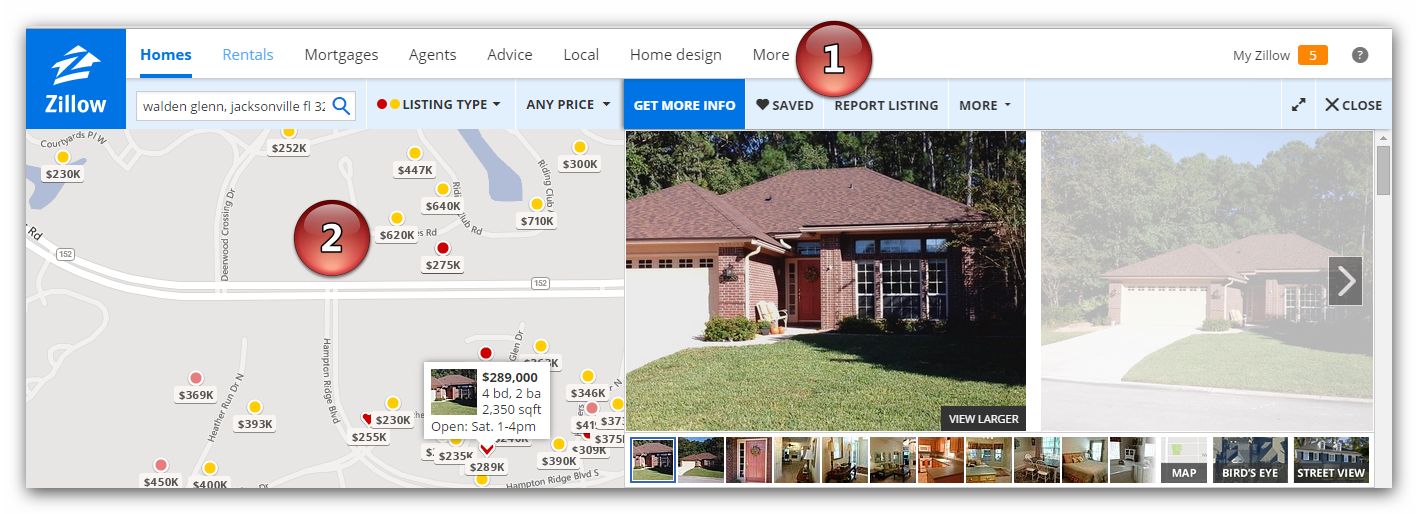
Click the image to make it larger
Now, go back and repeat those steps until you have entered all of your data in the spreadsheet.
Home Value Estimator System Step #3 – Sort and Create Calculations
You have collected all of your home value data and you are now ready to sort your data and add your calculations. If you have used the order that I suggested above, you can simply copy my formulas below. If you changed the order or added columns, you will need to make modifications to my formulas.
Sorting
Start by clicking your mouse cursor into cell A1. Next, click on the Sort and Filter button. When you click on that button, a drop down menu will appear and select Custom Sort.
Click on this image to make it larger
Next, a dialog box will appear. Make sure that the check box for My Data Has Headers is checked. Next, click on Add Level. You are going to sort by Date Sold in your first column and then by Date Listed for your second column. Leave everything else the same (make sure it is matching the image below. Next click OK.
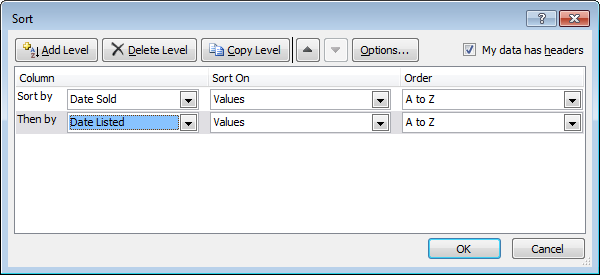
Click on this image to make it larger
This is going to sort your data from oldest to newest. Your Home Value Estimator spreadsheet will show the homes that have sold at the top and the homes that are still for sale at the bottom and they will be listed with the homes that have been on the market the longest at the top.
Home Value Estimator System Calculations
Now we are going to add your home value calculations.
Price Per Square Foot – The first home value calculation will find the price per square foot for each home. You are going to divide the square feet by the price. In Excel, this translates to =D2/G2. Type that calculation into cell K2. Copy and paste that equation down the spreadsheet column until you reach the end of your data.
Average Price Per Square Foot – The next home value calculation will tell us the average price per square foot for the last 5 homes sold. By taking an average of the previous 5, we can minimize the effect of a seller receiving an unusually low or high price. In Excel, click your curser into Cell L6 and type in =AVERAGE(K2:K6). Copy and paste that equation down the spreadsheet column until you reach the end of your data.
Days on Market – The last home value calculation you are going to add is the number of days that each house was on the market. If you just typed your dates into the spreadsheet, Excel will automatically turn them into a date. You are going to determine the number of days between the date that the home was listed and the date that it sold. In cell M2, type in =E2-F2. Next, copy and paste this down the column. Stop at the last home sold.
Congratulations. You now have your Home Value Estimator System data and are ready to analyze it.
Analyze Your Home Value Estimator System Data
Analyzing your home value data is part art and part science. You are through with the science portion of the analysis.
Let’s take a look at my sample data below.
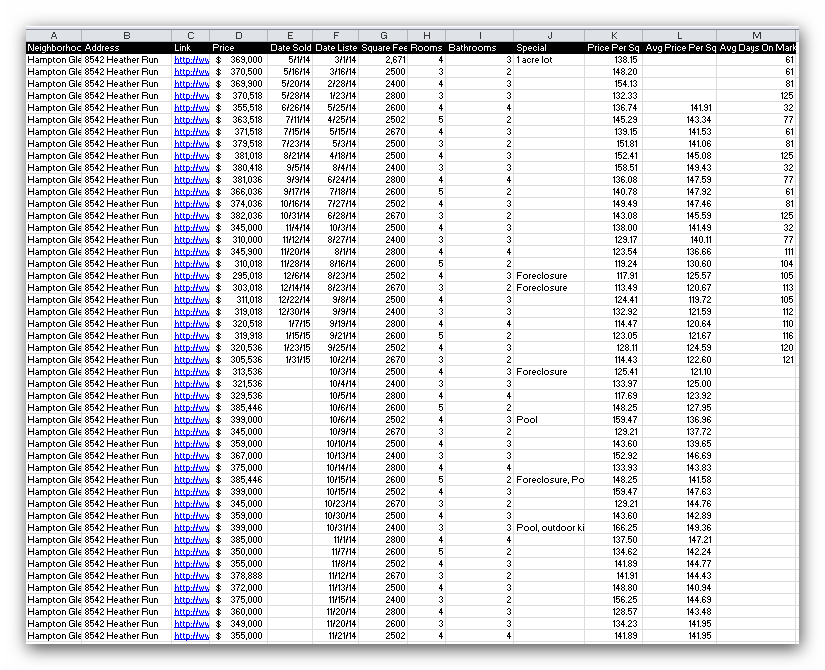
If I highlight all the cells for Average Price Per Square foot that have sold, I can see that my average selling price is $134.80 per square foot. This average number is shown on the bar at the bottom of Excel. Looking over at the next column (K), we can see that the rolling home value average price per square foot was in the 140s in the Spring, but has since dropped to the 120s. (This is sample data and you would normally not see that type of drop).
With a drop in home values like this, your target price should be closer to the overall average of $134.80 per square foot (or lower) to sell your home in an average or above average time frame.
In a falling home value market, you don’t want to be chasing the market down.
What does chasing the market mean? Let’s take a scenario where your home value is $250,000 today and the value is dropping $3,000 every month. You have your home listed for $270,000 this month and hold firm for 3 months. You decide to drop your price $10,000 after 3 months and your new list price is $260,000. After three months, your home value is no longer at $250,000, it is now at $241,000 and you are still overpriced. This is chasing the market.
Now you have a home value target price in mind of $135 a square foot. Go back and look at those homes that you noted with an asterisk (*) because they were similar to your home. What did those homes sell for per square foot? If it was drastically higher, then you can increase your price per square foot. But if it was lower, consider moving your price down even further. Remember to pay close attention to trends by time (are prices going up or down) and the current homes that are for sale (your competition).
Next, do you have any special features that you share with any of the other homes? Let’s say you have a pool. Look back at the homes that had a pool. How much more per square foot did they go for? In my sample data, no homes with a pool have been sold. However, four are listed for sale with a pool. My first question is, what is the average price per square foot for all homes that are still on the market? I highlight the cells in Column K that do not have a sold date and the information bar at the bottom of Excel tells me the average price is $141.71.
When I compare the price per square foot of homes with a pool versus the average price per square foot of all homes (141.71), I find that homes with a pool are priced $18, $7, $26, and $3 per square foot over the average. I would look at the photos of the pool, see what closely matches my pool to determine the additional price per square foot to add on to my list price.
How Fast Can I Sell My Home
You can never predict how quickly you can sell your home, but we still want to know what to expect. I know I do! This is going to depend on many factors. If you price your home in the sweet spot of the market, it will sell before or at the average. However, if you are pricing your home above the sweet spot (too high), prepare to stay in your home for a while longer.
Time of year can also be a factor. If you are selling in the spring, there are more buyers and it will likely sell much quicker. If you are selling in the winter, you have fewer buyers so it may take longer.
To figure out how long it will take to sell your home, look at the Average Days on Market in Column M. In my sample data it went from 60 days in the spring to 120 days in the fall. Considering that it takes 30-60 days to close on most homes, sellers were accepting offers in the first month during the spring and waiting 2-3 months in the fall. In this case, expect to wait 3 months before accepting an offer on average.
Got Questions About This Home Value Estimator System?
Thanks for hanging in there. You can ask questions about this Home Value Estimator System below in the comments section or head over to our facebook page and ask questions there. I’ll try to answer your questions within a day.
Executive Summary
Trying to figure out your home value and how long it will take to sell can seem difficult, but it really is not. With 1-2 hours of work on Zillow, you can find the homes that have sold in your area and put together a Home Value Estimator System. After you do this research, you will know as much as, if not more than, any real estate agent in your area. Start by gathering data about homes currently on the market for sale and data about homes that have recently sold. Make sure to gather at least 50 listings that are near your home (a combination of both homes that have sold and those that are still for sale). Once you have this data, you will sort it by date sold and date listed. Next, add home value calculations to find the price per square foot, the rolling average price per square foot and the days on market. Armed with this home value data, you can make some easy conclusions about how much to price your home for sale. Check out this case study showing how the right price led to a home sale in just 3 days.

